Understanding Median Household Income Maps
Median household income maps display the middle income level of households within a geographic area, offering a consistent benchmark. For retail banks and credit unions, they serve a crucial role in:
- CRA performance evaluations
- Branch placement decisions
- Lending penetration analysis
These maps often integrate data from the U.S. Census Bureau or tools like the Justice Map, combining income data with demographic overlays to help banks and credit unions identify low- and moderate-income (LMI) tracts.
Why These Maps Matter for CRA and Fair Lending
Retail lending compliance teams rely on household income maps to:
- Identify underserved communities where credit is lacking
- Monitor whether current lending patterns support LMI borrowers
- Demonstrate geographic lending distribution during CRA exams
- Uncover potential redlining risks
CRA regulators, including the OCC and FDIC, assess banks’ performance in serving credit needs across income levels. Income maps simplify the task of proving a bank’s commitment to these goals.
Key Use Cases for Compliance Professionals
- Lending Assessment by Census Tract: Ensure loan distribution aligns with demographic and income levels
- CRA Performance Mapping: Highlight lending reach into LMI communities
- Fair Lending Risk Reviews: Detect geographic disparities that may reflect bias
- Branch/ATM Location Planning: Ensure physical presence supports all segments, including LMI neighborhoods
- Regulatory Reporting Support: Visualize and document community investments efforts
Income maps provide a geographic audit trail for CRA and fair lending initiatives, which is critical during examinations.
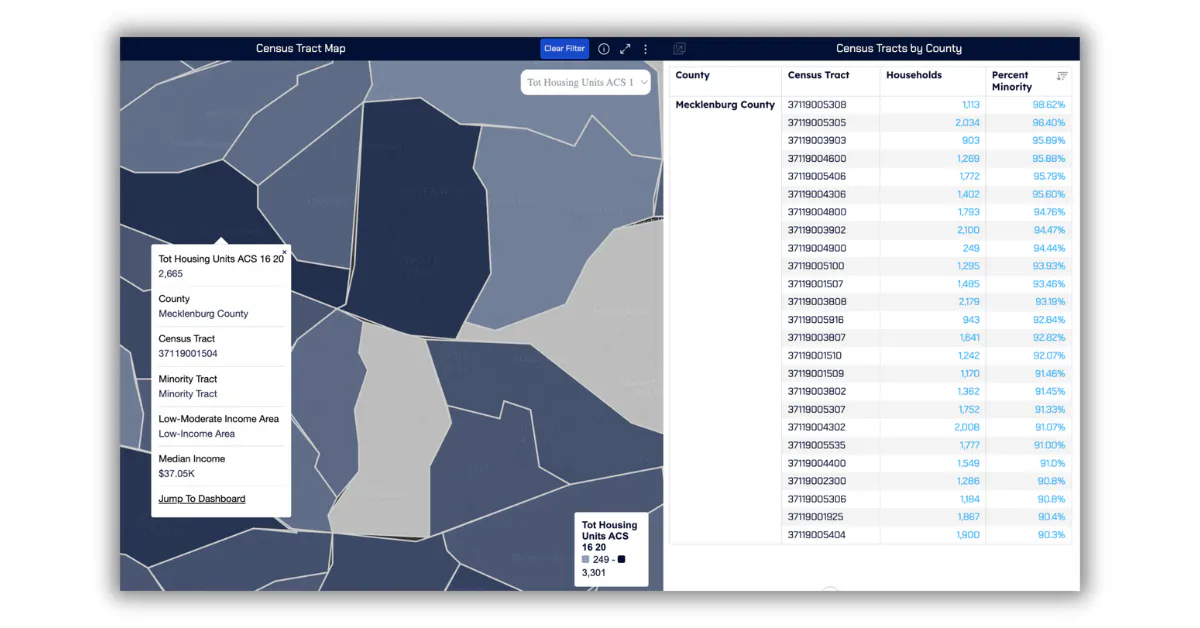
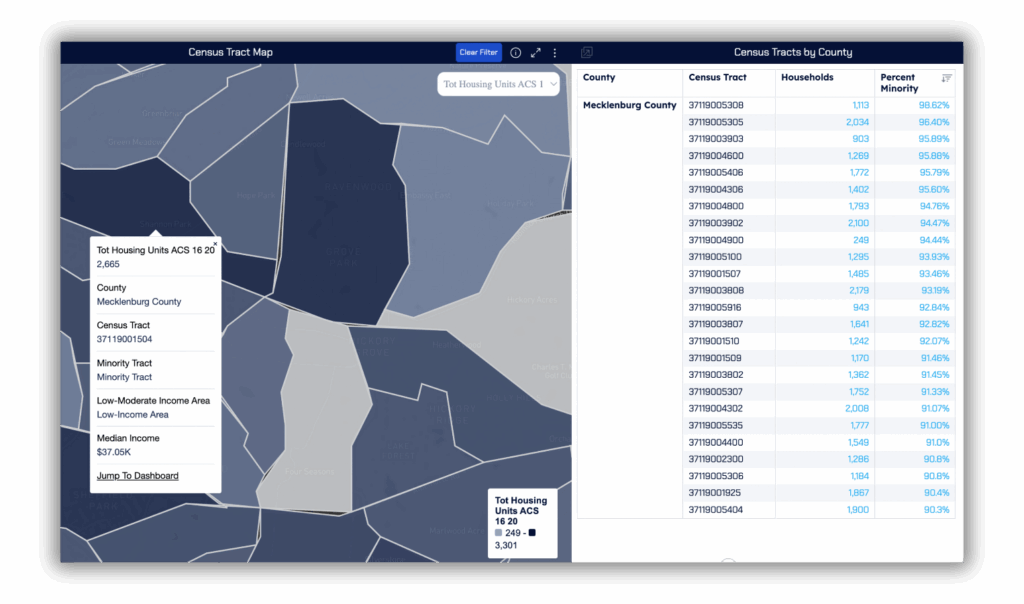
Interactive Income Maps: Hands-On Tools for Compliance
Interactive income maps, like the Visual Intelligence Boards offered by MMI, allow banking professionals to:
- Zoom in by state, county, zip code, and census tract level.
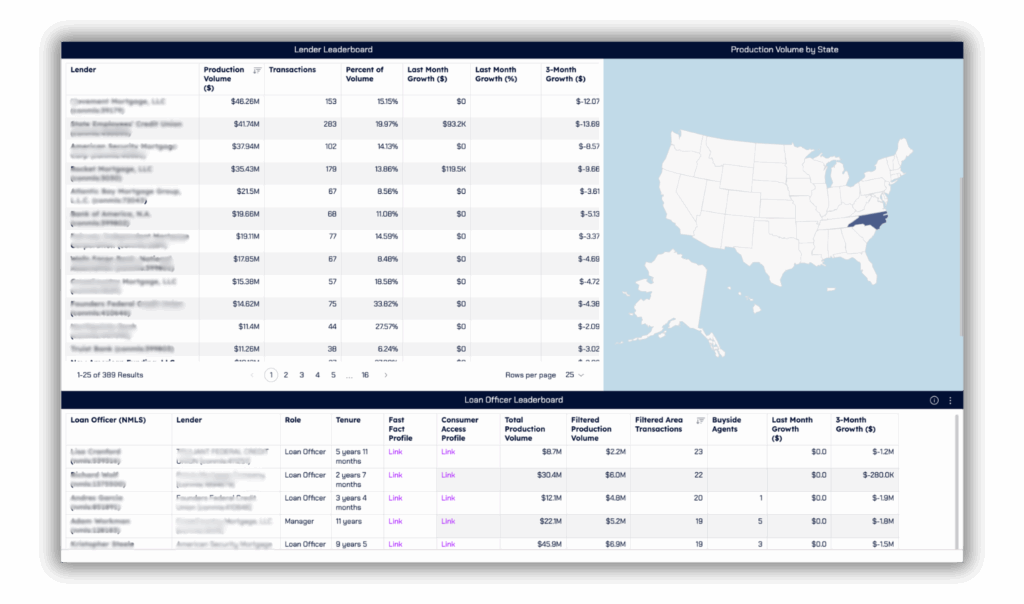
- Evaluate month-by-month production volume of lenders that have done business in a specified market during a time period.
- View and sort top-performing loan officers by tenure, volume, agent count, and recent growth.
- Filter by: date, lender name, lender type, MSA, state, county, zip code, minority tract, and race-specific households.
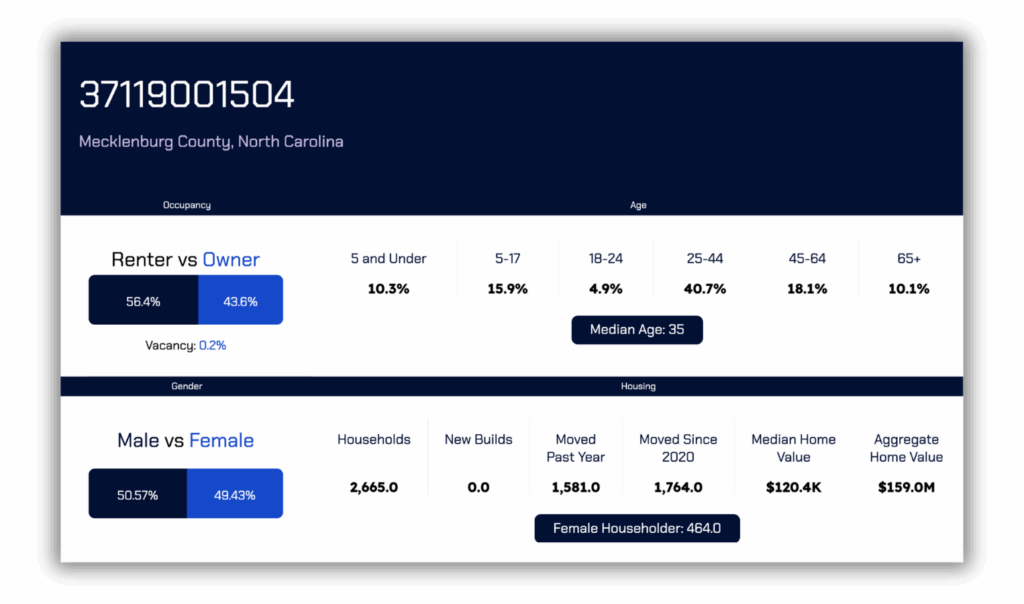
- Access census-level data of any census tract (race distribution, vacancy, household languages, education, employment, etc.).
MMI’s interactive income maps of LMI lending data cover census tracts in which the median income does not exceed 80% of the area median income.
Examples of High-Impact Insights
- Low-Moderate Income Households by County: Reveals neighborhoods underserved by current retail lending models.
- Percent Minority Low-Moderate Income Households: Pinpoint the areas that are mostly minority households and low-moderate income.
- State and County Comparisons: Support multi-state banks in identifying CRA performance gaps.
- Competitor Production Volume in Target Area: Uncover pent-up demand that isn’t being served by current market players.
Interactive Income Maps: Features and Benefits
Interactive income maps provide a dynamic way to explore income data. Users can easily navigate and customize views, enhancing engagement and understanding. These maps allow for real-time exploration of economic trends.
Such maps often feature tools for zooming in on specific locations or demographic segments. Users can select areas of interest and overlay additional data. This capability aids in detailed, data-driven analysis.
Key features of interactive income maps include:
- Customizable data layers
- Tools for selecting different regions
- Real-time data updates
- User-friendly navigation
Best Practices for Using Income Maps in Retail Lending Compliance
Use Census Tract Income Maps for CRA Planning
- Identify low- and moderate-income (LMI) tracts (≤80% of area median income) to align lending and outreach with CRA obligations.
- Spot underserved geographies that may benefit from branch expansion, financial literacy programs, or community investment.
- Use maps to plan and document CRA-eligible activities, such as small business lending or affordable housing projects.
Support Fair Lending Analysis
- Overlay lending activity on income maps to identify disparities in service across income levels.
- Use as evidence during fair lending audits to demonstrate proactive monitoring and remediation.
Benchmark Against Peer Institutions
- Compare your institution’s lending footprint in LMI tracts to peer lenders using HMDA data.
- Use map-based dashboards to identify areas where peer lenders are outperforming you in meeting LMI needs.
- Adjust strategy to remain competitive and avoid fair lending risk tied to market gaps.
Guide Product and Service Delivery
- Use income maps to tailor loan products, credit terms, and financial services to meet the needs of lower-income communities.
- Deploy mobile branches, community reps, or digital tools in areas underserved by traditional banking infrastructure.
- Create programs with features like down payment assistance, flexible credit requirements, or multilingual outreach based on the tract’s demographics.
Document and Defend Lending Strategy
- Maps provide visual documentation of where and why your institution is focusing efforts.
- Essential for exam readiness—clearly communicate how and where you’re meeting the credit needs of your entire assessment area.
- Support strategic plans with clear geographic rationale tied to income-based needs.
Monitor Performance Regularly
- Track month-over-month lending activity in target tracts to stay ahead of CRA and fair lending expectations.
- Evaluate whether strategy changes (new branches, campaigns, etc.) are having the desired impact in LMI areas.
- Use updated Census and FFIEC data annually to refresh tract classifications and income thresholds.
Conclusion: A Map Is Worth a Thousand Data Points
For retail lending compliance teams, the journey from data to decision-making hinges on having the right tools. While many maps of median household income offer general guidance, MMI’s Visual Intelligence Maps stand apart by delivering actionable intelligence tailored for CRA and fair lending requirements.
MMI’s CRA/LMI maps empower banking professionals to go beyond surface-level analysis. With census tract-level granularity, real-time production volume tracking, loan officer performance dashboards, and deep demographic overlays, these maps provide the full compliance context lenders need. Whether you’re identifying gaps in LMI lending, assessing loan penetration by minority tract, or benchmarking against competitors, MMI’s solution offers clarity, accuracy, and compliance confidence.
By leveraging MMI’s tools, banks and credit unions can not only meet regulatory expectations—but exceed them, turning compliance into a competitive advantage.
Explore MMI’s CRA/LMI maps today and unlock the full potential of your retail lending strategy.