Discover how CRA maps can enhance bank and credit union strategies. Learn about types, benefits, and tools that drive growth in financial services.

For financial institutions looking to grow responsibly while meeting regulatory expectations, CRA maps offer a valuable and often underused advantage.
These maps are essential for meeting requirements under the Community Reinvestment Act (CRA). They also help banks and credit unions see where they are serving communities, where they are not, and where they can grow. CRA maps help improve your CRA rating and guide smarter decisions about where to grow and serve.
CRA maps highlight the areas where banks and credit unions are expected to lend, invest, and provide services under the Community Reinvestment Act. These areas often include low- and moderate-income (LMI) neighborhoods.
CRA maps help institutions:
More than that, CRA maps can guide your growth strategy. They help you avoid blind spots and identify areas of opportunity.
There are several kinds of CRA maps. Each serves a unique purpose in helping institutions stay compliant and uncover new market opportunities.
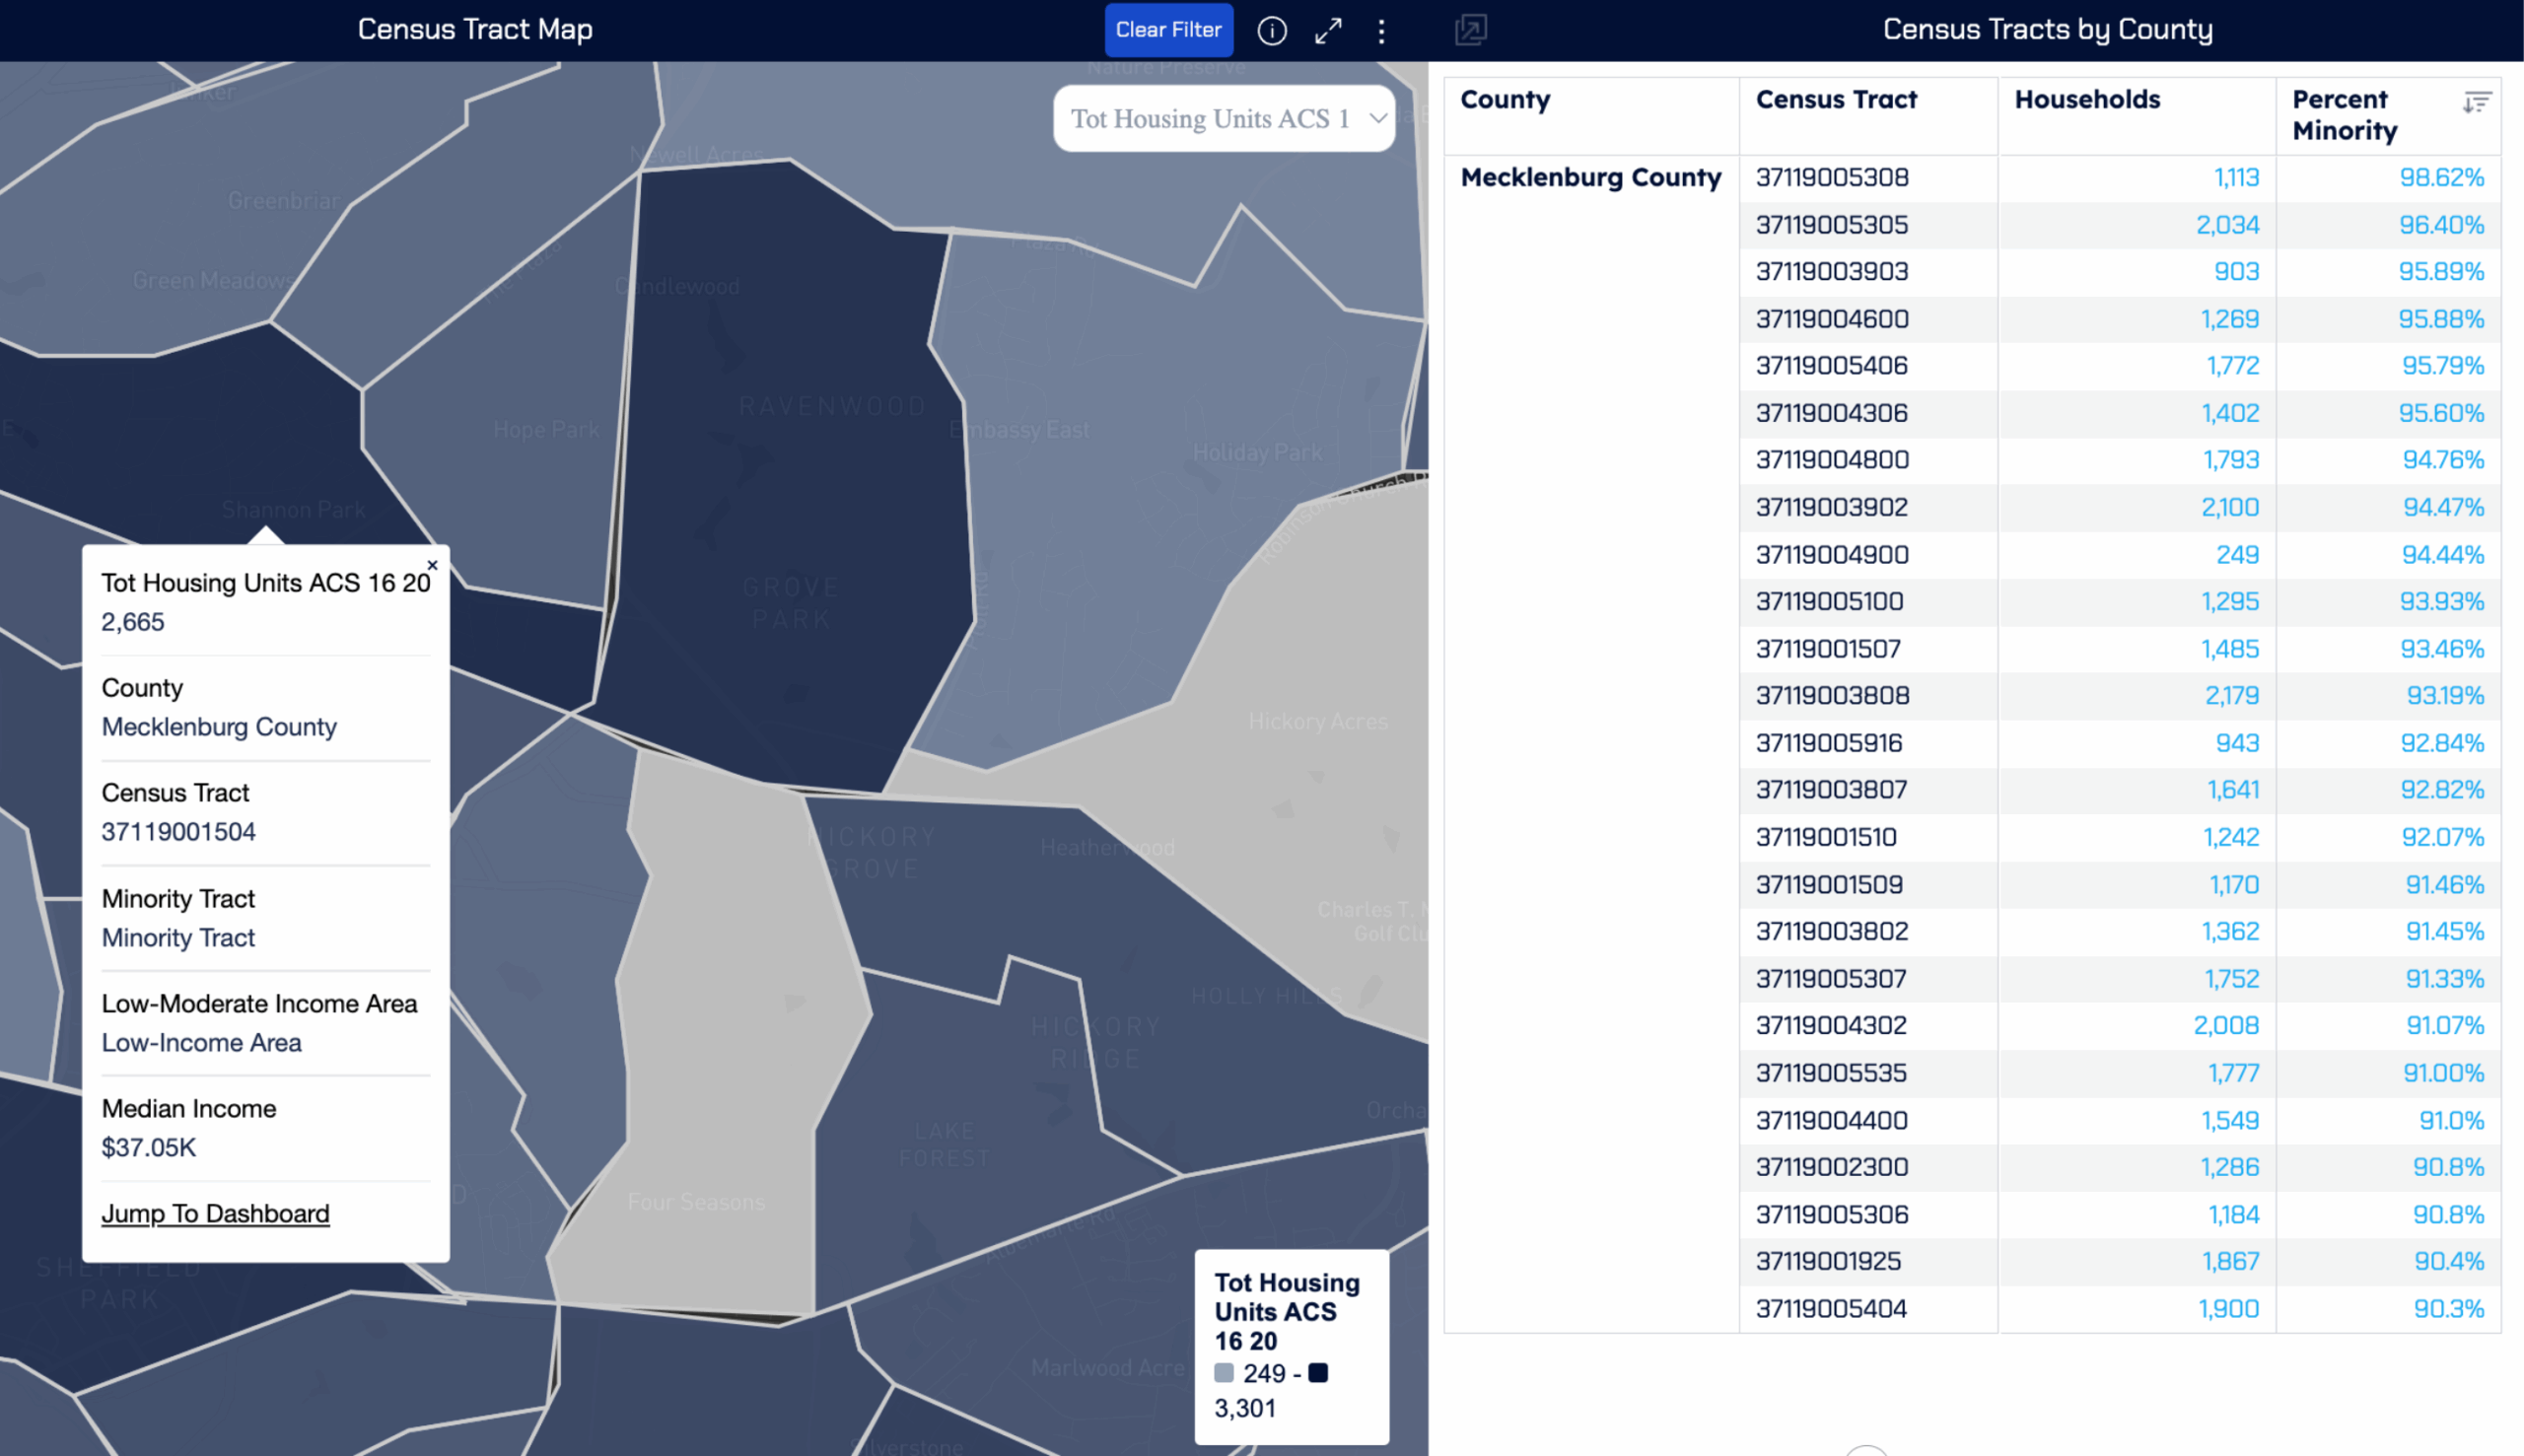
These maps break your footprint into small sections called census tracts. Each tract is categorized by income level—low, moderate, middle, or upper. These maps help:
These maps outline your official CRA service areas. You define the area, but regulators must approve it. The goal is to make sure you’re serving your full footprint. These maps help institutions:
This broader category includes any map used to support CRA strategy. These might show lending activity, deposit locations, or overlays of LMI areas. Combining multiple layers of data gives a better view of how you’re serving your communities.
CRA maps aren’t just for compliance. They help institutions plan smarter and grow responsibly.
CRA maps turn complex data into clear visuals. Instead of digging through spreadsheets, you can quickly see where your customers are and where more support is needed. They help with:
Growth doesn’t always mean entering new markets. Often, there’s potential right in your current footprint. CRA maps help spot:
These maps can also highlight risks. For example, if your loans are not reaching LMI tracts, that could raise concerns. CRA maps help you catch problems early and show regulators that you’re meeting requirements.
MMI offers tools that help banks and credit unions meet CRA rules and find new ways to grow and support local communities. Instead of using multiple systems, MMI combines CRA data and mapping features in one easy-to-use platform.
Key features include:
Dynamic CRA Census Tract Overlays
View current census tracts with lending data, income levels, and demographics. This helps you measure activity in low- and moderate-income neighborhoods and spot where lending may be missing.
Custom CRA Assessment Area Mapping
Easily define and adjust your institution’s CRA areas. See how your lending and deposit activity matches up and prepare documents for CRA reviews.
Lending and Deposit Heatmaps
See where you’re most active—and where you’re not. These maps help highlight underserved areas and support outreach planning.
Filterable Performance Dashboards
Filter by loan type, borrower income, and location to track performance. Compare trends across branches and over time.
CRA-Ready Reports and Public File Tools
Export polished, clear visuals for exams, internal reports, or your CRA public file. MMI makes it simple to show your efforts.
Integrated Market and Peer Data
Combine CRA insights with market trends and peer performance. This helps you align compliance goals with growth strategies.
Cloud-Based Access for Teams
Use CRA mapping tools from any modern browser. Compliance, marketing, and leadership teams can work together in real time.
With MMI, CRA mapping becomes part of your everyday decision-making—not just something you do once a year.
A Regional Bank Expands Responsibly
After a merger, a regional lender discovered several unserved LMI neighborhoods. They redrew assessment areas and increased mortgage activity by 12% within a year.
A Credit Union Plans a New Branch
A Midwest credit union used CRA maps to identify small business loan demand. They opened a new branch and doubled loan volume in 18 months.
A Community Bank Builds Local Partnerships
A California bank identified gaps in lending and partnered with a local housing nonprofit. Applications from LMI borrowers rose 25% in one year.
MMI helps banks and credit unions unlock the full potential of CRA mapping through a unified, data-rich platform.
With MMI, you can:
MMI brings CRA, market insights, and performance tracking into one place. This helps institutions connect compliance to business goals—from improving community support to growing market share.
CRA maps are evolving quickly.
More financial institutions are combining CRA mapping with tools that track digital inclusion, climate risk, and neighborhood change. As fair access to financial services becomes more important, using CRA maps to show active community support will help your institution stay ahead.
AI and automation are also changing how CRA strategies are built. These systems can now spot new LMI areas, warn of coverage drops, and suggest next steps based on CRA rules and local needs. This makes CRA maps not just a tool for looking back—but a way to plan forward with purpose.
CRA mapping is no longer a behind-the-scenes task used only for audits. It’s a powerful way to uncover opportunity, avoid risks, and grow with purpose. Banks and credit unions that use CRA data in their planning will be better prepared to grow and support the communities they serve.
Today, with a growing focus on fairness and clear data, CRA maps help you see where you stand, where to go next, and how you’re making a difference.
Explore how MMI can support your CRA strategy with actionable geographic intelligence.
Learn more
Request a demo
